x-axis alternatives

April 2020 | Storytelling with data

Diagonal elements in visual communication are attention-grabbing. They look messy. In the case of text, the diagonal orientation makes it slower to read. Why is it, then, that many graphing tools default to diagonal labels when the x-axis becomes crowded? Or perhaps a better question: what can we do instead?Only mention every 3th month, people are smart enough to fill in the rest, especially when adding some gridlines . Simple but elegant.

Providing feedback

February 2020 | Storytelling with data

Soliciting feedback and iterating are incredibly important parts of the process for evolving our data communication skills. Getting good at giving feedback can also help sharpen your thinking in ways that ultimately improve your own work. As even more benefits, giving feedback in a constructive manner can not only have positive impact on the work of those to whom you give feedback, but also when it comes to effectively framing the feedback you’d like from others.
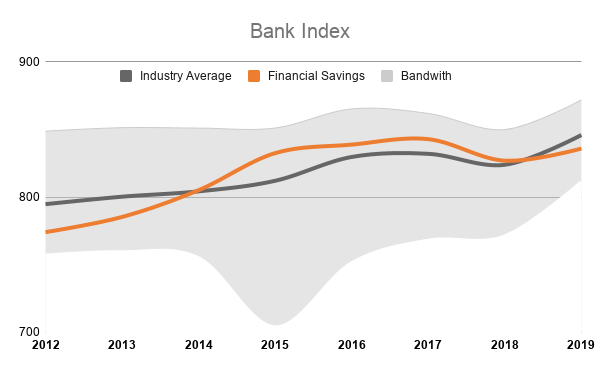
Thanks for preparing the 2019 Bank Index Graph, think you did a great job on collecting the data and making the first version of this graph. From the data it looks like we did not very well last year, we cannot hide this fact but we must make sure we present those figures in such manner it will not make things worse.

To be able to draft a decent picture it would be good to keep your audience and message in mind, could you please share with us who the intended audience is and what message you would like to convey? Is there a clear reason for the drop of our index in 2019? maybe we should explain this in a short guiding text.

Some initial feedback on your chart;

  • Showing all banks as a separate category can be a bit overwhelming and will probably distract from the important data. Maybe it is an idea to display our index, the industry average and combine it with a min/max or bandwidth?
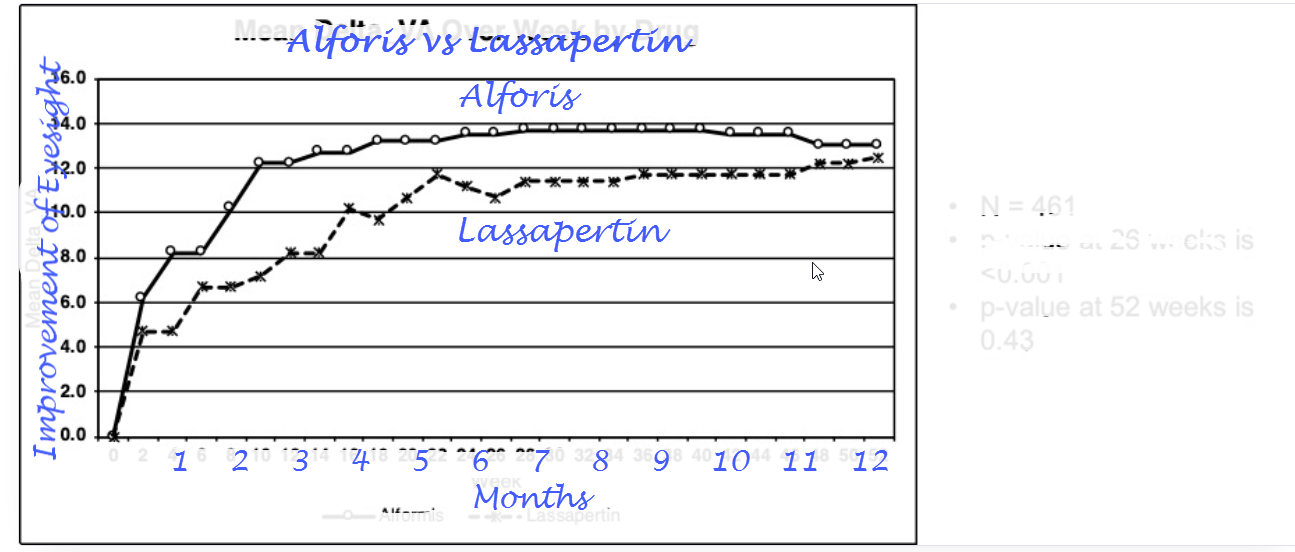
  • Using an x/y scatter for a time based chart is not always the best solution, It doesn’t make it easy to compare one year with another. Maybe it is better to use a simple line chart.
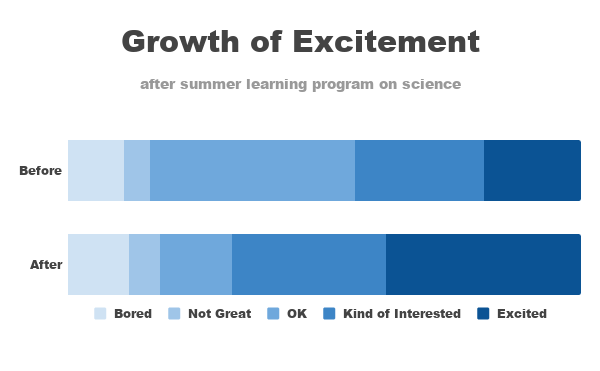
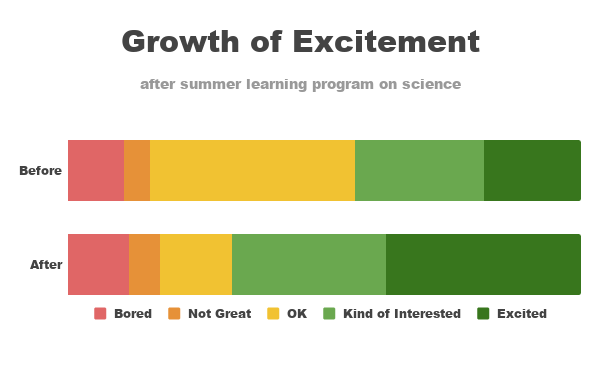
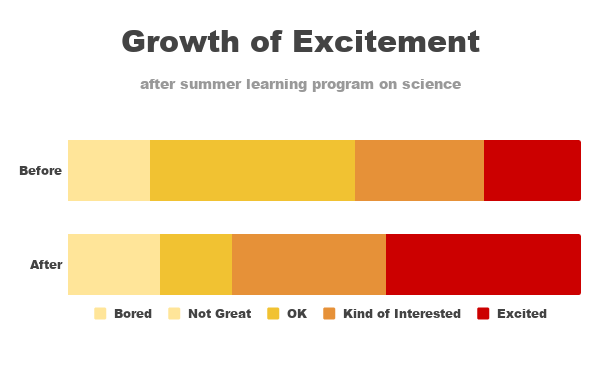
  • Please be aware of our corporate branding, for the elements representing ‘Financial Saving’ you should use the ‘Financial Saving – Close to Dark Orange’ for the supporting elements I would like to advise you to use a neutral color(grey or from the Pallet in our Corporate Communication Guidelines(CCG). By sticking to the CCG as much as possible your message will be consistent with other FS communication and will be better recognizable.

Hope this helps to improve your Graph, if you have any questions, please feel free to contact me.

Regards,
Conrad

PS. I’ve attached my try on visualizing this data, please feel free to build on that.

Color + words

February 2020 | Storytelling with data

First, employ color sparingly to direct your audience’s attention to where you want them to look. Second, use words to tell your audience why you want them to focus there. This can be in your spoken narrative, written directly on the graph or slide, or a combination. These two simple things can go a long way in overcoming other issues. Perhaps it’s not the perfect graph type or there is some clutter present. But if you can indicate to your audience where they should look and why, this can still be a successful communication scenario.In general the simpler the graph the understandable it is. I’ve removed the total (doesn’t add much if you want to highlight the event where Organic becomes bigger than Referral. Added a nice red circle to focus on that point. Put the labels in the Graph (in the rising and faling direction)

Declutter!

February 2020 | Storytelling with data

A frequent source of clutter in data visualization comes from unnecessary graph elements: borders, gridlines, data markers, and the like. These can make our visuals appear overly complicated and increase the work our audience has to undertake in order to understand what they are viewing. As we eliminate the things that don’t need to be there, our data stands out more. Let’s take a closer look at the benefit that decluttering can have on our data visualizations.
I’ve tried to find a solution to show lower is better without using words, unfortunately this makes a less appealing chart. Ended up with a clean smooth line chart. Maybe it could be improved by removing the legend and adding labels to the lines, only could not figure out where to put them so keep the legend.
The labels in the original are not adding much to the overall result, most important is the distance to the goal. Also removed the year from the months on the x-axis and added it to the title.

Words help data make sense

February 2020 | Storytelling with data

Words can help make data make sense. That said—which words we choose to use can vary a ton, depending on exactly who we are communicating to. In some cases, quick and dirty output directly from our tool might be totally fine, whereas other situations will call for an intentionally designed graph and widely accessible language. Let’s look at a specific scenario and explore the use of words given varying conditions.When communication to the general public, a more generalized and simplified chart could be beneficial. when starting from scratch I would use Brand colors (at least for our winning brang) in the chart. Smooth it out a bit, maybe cheat by stopping at 10 months (the difference at 52 wk is minimal)

For now I have removed all detailed information which just distracts, added a clear title. Removing the legenda and put the product names in the chart will make it more visible which line is which. Counting in weeks is not something lot of people are used to, therefore changed the X-axis to months. Changed the Title of the Y axis to a more understandable metric (not completely factual but it conveys the message)

Alternatives to pies

June 2020 | Storytelling with data

You’ve just completed a summer pilot learning program on science aimed at improving perceptions of the field among young elementary children. You conducted a survey going into the program and at the end of it, and want to use this data as evidence of the success of the pilot program in your request for future funding.
It is so tempting to use a pie chart when you have a limited set of data, the risk of faling back on the trusty old pie is the limited options to compare. For this challenge I’m falling back on an old favorite, the 100% bar chart. with two 100% bar charts it is easy to see movement over the whole range (especially when like in this case, using a scalable but not so exact set of categories.

Only not completely sure on the colors, I’m more used to a risk based approach in which the lack of excitement will be red and the more engaged/excited group will get the less exciting green. Also tried the les to more exciting yellow to red, this also didn’t work out as good as hoped. At the end I decided to just pick a color and do a scale from light to dark (probably the way I would do it when doing it in an environment where colors are limited by some sort of guideline.